Ocean AKS Cloud Cluster Overview Dashboard
The Cloud Cluster Overview dashboard provides enhanced functionality to analyze the Ocean autoscaler actions with high granularity and gain deeper insights into its behavior. This topic delves into this dashboard's various components and sections, offering a detailed exploration of its capabilities.
Ocean continuously analyzes the utilization of your nodes in the cloud infrastructure. It automatically scales compute resources to optimize utilization and availability. It achieves this by intelligently combining spot, reserved, and regular compute instances.
- Ocean Savings panel shows the amount of money, CPU, memory (GiB/TiB), and GPU compute resources saved when you utilize Ocean to manage your Kubernetes cluster. Specifically, these are savings from running spot instances, bin packing, and reverting to lower-cost nodes.
- The Ocean Managed Nodes and Resources panel shows information about your Ocean-managed and unmanaged nodes and your managed CPU, memory, and GPU resources.
- Resource Allocation panel shows resource allocation information about your managed CPU, memory (GiB/TiB), and GPU resources at the cluster level.
- Drill down to view resource allocation information at the namespace, Virtual Node Group, node pool, or node level. Each has a dedicated tab to the right of the Overview tab.
Access the Ocean Cloud Cluster Overview
To access the Ocean Cluster Overview dashboard:
- click Ocean > Cloud Clusters in the left main menu.
- Select a cluster from the list of clusters.
Ocean Savings Panel
The Ocean Savings panel contains a set of savings widgets (displayed as tabs), which show your savings according to Ocean’s main autoscaling processes for cluster optimization in a selected time range:
- Running on spot: Savings from running on spot nodes instead of OD nodes.
- Bin packing: Ocean proactively identifies underutilized nodes and efficiently bin-packs the pods on them to scale down the nodes and reduce the cluster cost.
- Revert to lower cost: Ocean scans all nodes managed by Ocean and replaces them with cheaper options. If the savings exceed 40%, it will replace the node pool. The mechanism identifies node pool candidates that maximize cost efficiency.
- Right-sizing: Savings from right-sizing your workloads.
In this panel:
- You can select a time range for displayed data from the drop-down list to the right of the savings widgets. Available options are Last 30 Days, Last 7 Days, and This Month.
- For each savings widget, click on "How is it calculated?
Ocean Savings from Running on Spot
Ocean autoscaler intelligently leverages these spot instances when appropriate, reducing costs while maintaining high availability. This tab lets you view the cost benefits of using spot instances in your cluster. Ocean savings from running on spot are calculated as the difference between the price of regular and spot nodes within a specified time range. This calculation considers the number of CPUs, memory, and GPUs running as spot nodes.
To view these savings, click the Running on Spot tab (unless already displayed).
This tab displays:
- Total cluster savings and the percentage of the saved cluster costs in the selected time range, where:
- Total cluster savings = [price for running regular instances – price for running spot instances].
- Percentage of cluster costs:
[[total price for running regular instances – total price for running spot instances] / [total price for running regular instances] x 100].
- CPU resources in vCPU Hours.
- Memory resources in GiB/TiB Hours.
- GPU resources in GPU Hours.
Ocean Savings from Bin Packing
In the context of autoscaling, bin packing savings are calculated based on the vCPU, memory, and GPU resources of the nodes that have been Scaled Down by the Ocean Autoscaler. Once a minute, Ocean simulates whether any running pods can be moved to other nodes within the cluster. If so, Ocean drains those nodes to ensure continuous infrastructure optimization and increased cloud savings.
This process ensures high resource utilization, reducing the number of nodes required and the overall cost. This efficient resource allocation shows you how much you're saving.
To view these savings, click the Bin Packing tab (unless already displayed).
This tab displays:
- Number of scaled-down nodes:
- Resource savings from bin packing in the following units:
- CPU resources saved in vCPU.
- Memory resources saved in GiB.
- GPU resources saved in GPU.
If one or more nodes have been scaled down, click the link on the Node Scaled Down button to view details in the Bin Packing window.
View image...
- Number of scaled-down nodes.
- Pie-chart: Virtual node group percentage breakdown for nodes.
- Pie-chart: Lifecycle percentage breakdown (regular, Savings Plans, Reserved Instances, and spots).
- Node Name.
- Virtual Node Group: You can click the link for a listed virtual node group to display more details.
- Node Pool (name of node pool).
- VM Size: For example, standard_f4s
- Lifecycle: (regular, Savings Plans, Reserved Instances, and spots).
- Scale-Down Timestamp, for example, 06/25/2023 09:23:15
Ocean Savings from Reverting to Lower Cost Node Pools
This process searches for node pools that can be replaced with lower-cost node pools. For example, suppose a pod was initially placed on a more expensive node due to resource constraints. In that case, Ocean autoscaler can replace it with a less expensive node when it becomes available, consequently saving costs. This tab lets you see how much you save from this dynamic resource allocation.
Ocean savings for reverting to a lower-cost node pool are calculated from the difference in price between the old scaled-down nodes from the specific node pool and the new scaled-up nodes, which are assumed to be related to several different node pools. For more information, see Revert to Lower Cost Node pool.
To view these savings, click the Revert to Lower Cost tab (unless already displayed).
This tab displays:
- Nodes reverted to lower cost:
- Resource savings from reverting to lower cost in the following units:
- CPU resources saved in vCPU.
- Memory resources saved in GiB.
- GPU resources saved in GPU.
If one or more nodes have been reverted to lower cost, the number of reverted nodes appears.
Click Revert to Lower Cost to view the number of nodes reverted to lower cost in the selected time range in the Revert to Lower Cost window.
View image...
-
Number of nodes reverted to lower cost.
-
Avg. percentage hourly cost saved: Avg. percentage cost reduction from reverting to the new VM type:
[[old hourly cost - SUM (new hourly cost)]/(old hourly cost) * 100]
-
Pie chart - Virtual Node Group percentage breakdown.
-
List showing replacement information: an entry for each reverted node pool is listed with these details:
- Node pools of the scaled-down and scaled-up nodes.
- Number of scaled-down and scaled-up nodes.
- Hourly cost of the scaled-down and scaled-up nodes. Displays the total cost of all nodes in the same node pool:
[nodes count * hourly price]
- Hourly cost saved as a percentage: % Cost reduction from converting to all the new VM type:
[[SUM(old hourly cost) - SUM (new hourly cost)]/[SUM(old hourly cost)] * 100]
- The Virtual Node Group's name (click the link for a listed VNG to display your custom VNG details).
- Scale-down timestamp in format MM/DD/YYYY HH: MM: SS
Ocean Savings from Right-Sizing Your Workloads
This tab will only be available if the optional Ocean automatic right-sizing feature is installed and enabled in your deployment.
These are your actual savings from using the Ocean automatic right-sizing feature.
To view these savings, click the Right-Sizing tab (unless already displayed).
If no workloads have been optimized with automatic right-sizing, create and attach right-sizing rules to your workloads in the right-sizing Advanced Optimization tab.
This tab displays:
-
Total cluster savings from down-sizing recommendations and the percentage of the saved cluster costs in the selected time range, where:
- Total cluster savings = [costs for workloads based on original requests – cost for workloads based on Ocean-optimized requests].
- Percentage of cluster costs: % savings = [[costs for workloads based on original requests]-[cost for workloads based on Ocean-optimized requests] / [costs for workloads based on original requests] * 100]
-
CPU resources in vCPU Hours.
-
Memory resources in GiB/TiB Hours.
-
GPU resources in GPU Hours.
Click View Details on the right of the right-sizing tab to see your actual right-sizing savings,
Ocean Managed Nodes and Resources Panel
This panel contains a set of widgets that display categorized information on your managed nodes and resources.
- Ocean-Managed Nodes: a widget that shows the following:
- Pie-chart - numerical breakdown for managed/unmanaged nodes. Hover over the chart to view more information.
- List of % and # of Spot. regular and unmanaged nodes.
- Ocean Managed Resources: a widget showing your managed resources.
- CPU - Total # units, #, and % for managed spot nodes / regular nodes.
Autoscaling Activity Panel
The Autoscaling Activity panel contains the following widgets:
- Scale Up widget.
- Set of Continuous Optimization widgets.
- Autoscaler graph.
Scale Up
This widget displays scaling-up events, which are instances when the Ocean autoscaler increases the resources (CPU, memory, storage) in your cluster to accommodate higher workloads. A scale-up event is triggered when there are 'unschedulable' pods, i.e., pods that cannot be placed due to insufficient resources like CPU, memory, or GPU on the existing nodes. In response, Ocean autoscaler identifies the optimal nodes to place these pods and increases the resources accordingly. This process ensures efficient resource allocation, improved performance, and shorter processing times.
Scaling up nodes also enables allocating more resources to specific tasks, improving performance and reducing processing time.
The Scale Up widget shows the number of scale-up events and scaled-up nodes in the selected time range. Tracking these events on the Autoscaling Activity panel allows you to monitor how effectively your cluster responds to workload demands.
For more information, see Scale Up.
Continuous Optimization
Ocean autoscaler performs several automatic processes to optimize cluster resources.
Scale Down
Scaling down nodes refers to reducing the resources (such as CPU, memory, GPU) of individual nodes in a cluster.
Ocean autoscaler scales down nodes when the cluster is over-provisioned and does not utilize the full capacity of the nodes. In this case, scaling down right-sizes the resources to match the workload. In addition, if specific nodes in a cluster are consistently underutilized, Ocean autoscaler scales down to redistribute the resources to other nodes or consolidate the workload onto fewer nodes.
For more information, see Scale Down.
The Scale Down widget shows the number of scale-down events and scaled-down nodes in the selected time range. By monitoring these events on the Autoscaling Activity panel, you can track how your cluster optimizes resources and reduces costs.
Revert to Spots
Suppose a node was launched as OD due to the unavailability of spot nodes in the market. In that case, Ocean continuously scans the market for an available spot node and reverts promptly upon finding one.
The Revert to Spots widget shows the number of events for which a regular node was reverted to a spot node in the selected time range.
By monitoring these events on the Autoscaling Activity panel, you can see when and how often your cluster utilizes spot nodes to exploit cost-saving opportunities.
Revert to Commitments
Nodes may be launched as spots or regulars due to unavailable commitments (RI or SP). Ocean continuously scans the market for available commitments. When it finds them, it reverts the spots/regulars to commitments.
Spots are first reverted to regular nodes and then associated with RIs or SPs.
The Revert to Commitments widget shows the number of events for which a spot/regular nodes was reverted to a commitment in the selected time range.
Monitor these events on the autoscaling activity panel to see how your cluster dynamically adapts to changes in the cloud market and exploits the cost-saving opportunities of commitments.
For more information, see Reserved Instances.
Revert to Lower Cost
Ocean autoscaler searches for nodes with lower-cost alternatives. If the savings exceed 40%, the node pool and associated nodes are replaced.
The number of scaled-down nodes does not have to match exactly the number of scaled-up nodes, and vice versa. Ocean replaces the node pool and its nodes by identifying cheaper pools that match the existing workloads. Before initiating replacements, Ocean runs various validations and filters. Once all conditions are met, the process guarantees the most suitable replacement for the node pool while maximizing cost efficiency.
The Revert to Lower Cost widget shows the number of events for which a node was reverted to a lower-cost node in the selected time range. For more information, see Revert to Lower Cost Node.
Tracking these events on the Autoscaling Activity panel lets you see when and how often your cluster is optimizing for cost savings.
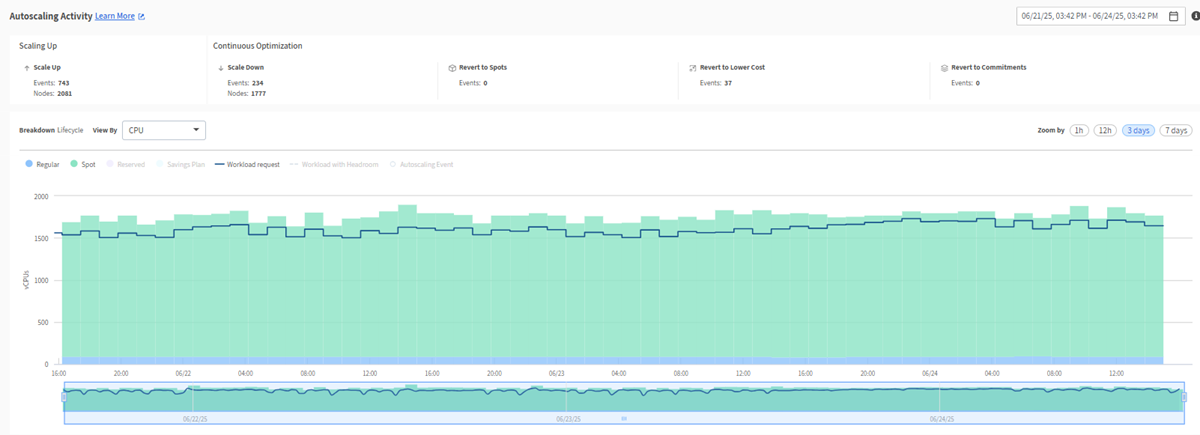
Autoscaling Activity Graph
The Autoscaling Activity Graph provides intuitive insights into the interaction between the Ocean infrastructure and the applications it supports. It also provides cluster activity insights at a granular level so you can see why the Ocean autoscaler triggered a specific scale event within the cluster.
The graph displays a breakdown by lifecycle, which you can view by vCPU, Memory, or GPU, together with workload and headroom requests.
The upper graph displays the autoscaling activity to analyze. By default, it displays a full set of activity curves. Click an item on the legend above the graph to turn its associated curve on or off.
These are the curves:
- Lifecycle Types:
- Spot.
- Regular.
- Reserved Instances
- Savings Plans
- Workload Requests: includes running pods and pending pods requests.
- Workloads with Headroom: includes running pods, running Headroom pods, pending pods, and pending Headroom pods.
The pending pods include all the pods in the Kubernetes cluster (pods that will be scheduled on Ocean nodes and those that won’t).
Set the Zoom Level for the Graph
- On the top-right of the screen, select to zoom by 1 hour / 12 hours / 3 days/ 7 days.
- Use the lower graph to zoom in or out of the selected period by dragging the sizing handles left or right.
Set the period on the graph to 12 hours or less to view autoscaling events, which are displayed as dots on the graph.
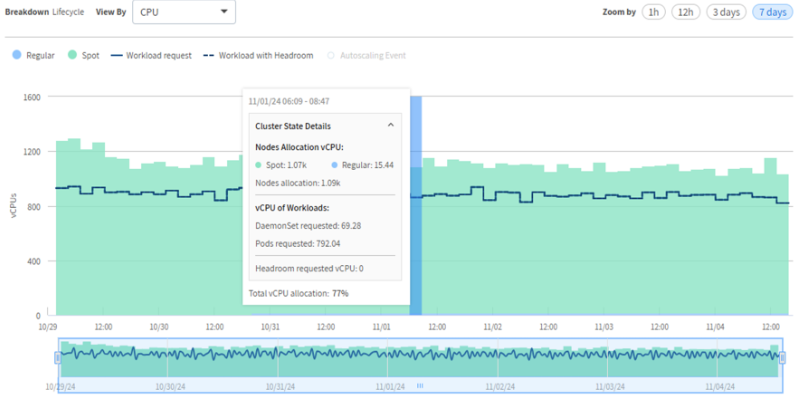
Display Autoscaling Activity at a Specific Point on the Graph
- Mouse over the upper graph to view the main details.
- Click Cluster State Details to view more information.
This is the information displayed:
- Autoscaling events (displayed for a period of 12 hours or less): One or more autoscaling events are displayed in blue rectangles. These can be any Ocean autoscaling scale-up and scale-down events displayed as widgets above the graph. For example, Scale Up or Scale Down.
For vCPU/Memory(GiB)/GPU:
- Nodes Allocation:
- Total node allocation.
- Split according to lifecycle types.
- Workload:
- deamonSets Requested.
- Pods Requested.
- Headroom requested.
- Total workload allocation percentage (includes only running pods, headroom pods, and DaemonSets pods scheduled on Ocean nodes).
Total Allocation Calculation:
- Sum of vCPU/Memory/GPU allocation - (running pods + running headroom + running DaemonSets)/nodes allocation.
To view more detailed information about autoscaling events:
Display Extended Details for Revert to Events
- Set the zoom level to 12 hours or less (described above).
- Mouse over the revert to event on the curve.
- Click the (shaded) revert event in the main details to show the extended details.
These are the extended details:
- Affected node pools (new/replaced).
- Nodes count.
- Virtual node group (click on the link to view virtual node group details).
- VM Size.
- Availability Zones.
- LifeCycle (Spot/regular).
Resource Allocation Panel
This panel displays a cluster-level summary with widgets for CPU /Memory /GPU resources allocated to pods. You can review allocation trends over time. Use this information to verify that infrastructure utilization is maintained at 70-80%.
- CPU
- Memory
- GPU
Each widget displays:
- % Workload allocation.
- % Total allocation (including headroom). Total workload allocation percentage (includes only running pods, running headroom pods, and running DaemonSets pods scheduled on Ocean nodes).
To view more details:
- Click an item on the legend above the graph to turn its associated curve on or off.
- Select the time period to view at the top-right of the screen ( last 6 hours/1 day/7 days).
- Hover over a curve to see the resource allocation and percentage value at a specific point in time.
The Nodes tab shows the percentage workload allocation at the node level. The Resource Allocation panel contains widgets for CPU, memory, and GPU allocation per node over time.
- % Workload allocation.
- % Total allocation (Including headroom).