View Your Savings
Once Eco Azure has been enabled for your organization and you have chosen your reservation and savings plan strategy, your Eco Azure dashboard will display a more complete view of savings.
To view the Eco Azure dashboard in the console, go to Eco on the left menu and click Dashboard.
Filters
The default view of the Eco Azure dashboard shows data from all the subscriptions in your Azure Tenant.
During the first setup of the Eco Azure dashboard, data from the past 90 days is loaded and then updated daily going forward.
By default, the dashboard shows all loaded data from Azure that Eco Azure has available. However, you can use the drop-down filters to limit the scope of data displayed.
You can set the following filters:
- Time: Choose the range of dates for which data will be displayed for the chart and tables.
- Regions: Choose the regions which will be included in the chart and tables.
- Services: Choose the services which will be included in the charts and tables.
Summary Line
The Overview dashboard includes a summary line that displays the following information:
- Current Monthly Commitment: The dollar amount of monthly commitment for reserved instance coverage.
- Current Monthly Waste: The dollar amount of monthly waste for reserved instance coverage.
Graphs and Charts
Eco Azure provides summary graphs and charts to give you wide visibility of your savings and commitments. The graphs and charts can be filtered according to the items in the legend. The following graphs are displayed:
Savings over Time
A bar graph showing the amount of savings each month broken down by type of savings. This graph displays the savings from reservations and savings plans. You can use the filters at the top of the page and source filters specific to each graph.
- All
- Eco
- Non-Eco

Reservation Order Details
Below the savings over time chart, you can see a table with detailed information about your reserved instances.

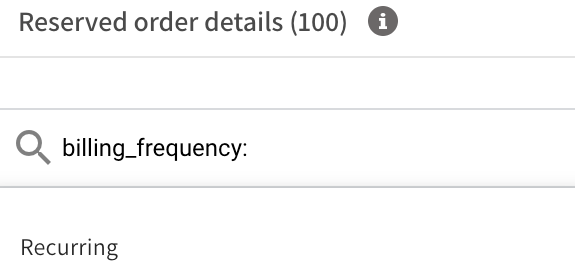
Filter Data
You can filter the data displayed according to several criteria available.
-
Place your cursor in the filter and click a parameter.
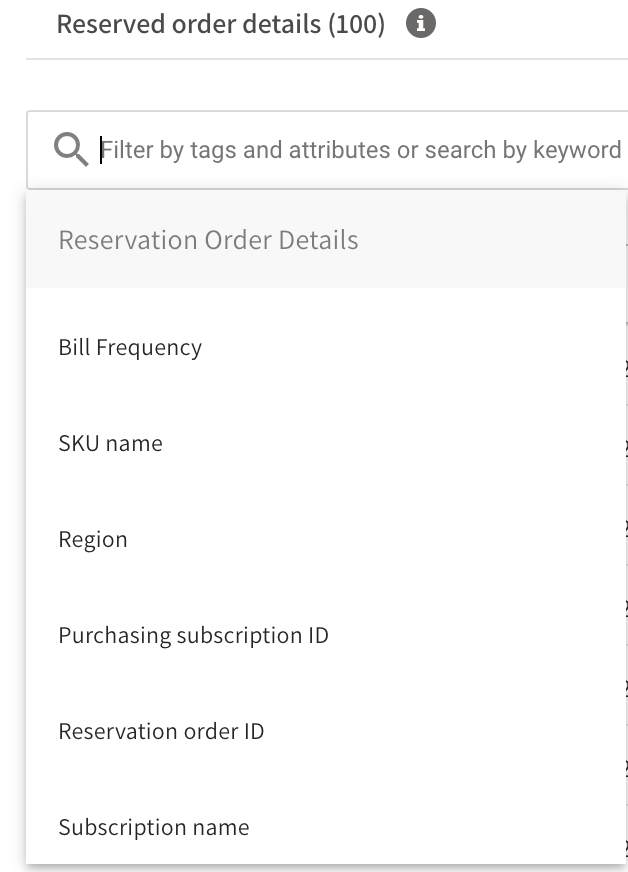
-
Choose the specific value(s) to be displayed by typing them or selecting from the list.
Display Columns
The following column headings are displayed:
- Reservation order ID: Azure reservation order identifier.
- Reservation ID: The identifier of the reservation.
- Reservation Name: The name of the reservation.
- Purchasing Subscription ID: The subscription being charged for the reserved instance.
- Subscription name: Purchasing subscription name.
- Reservation Type: Displays the different types of RIs available. Eco supports only virtual machines.
- Start date: Start date of the reservations.
- End Date: End date of the reservations.
- Region: The regions specified for the reservation.
- Scope: The scope applied to the reservation.
- SKU name: The name of the product the reservation will cover.
- Quantity: Number of reservations bought.
- Amount: Cost of the reservation.
- Bill frequency: Azure reservations can be billing up front or monthly.
- Source: Eco or Non-Eco.
Export Data
To export the Reservation Details report to a CSV file, click Export above the table.
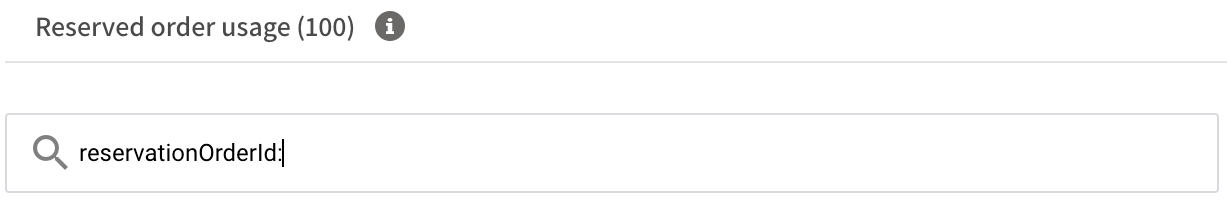
Reserved Order Usage
Below the reservation order details, you can see a table with detailed information about your reserved instances, including the Utilization per reservation.

Filter Data
You can filter the data displayed according to several criteria available.
-
Place your cursor in the filter and click a parameter.
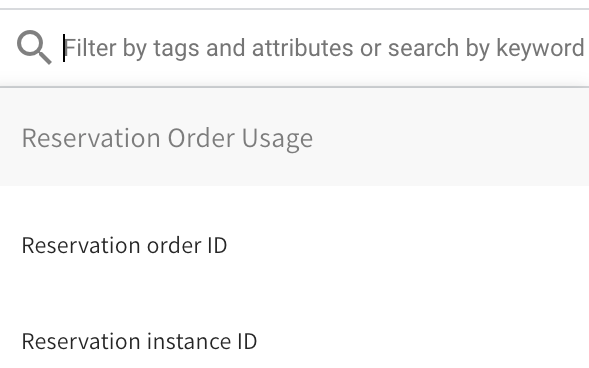
-
Choose the specific value(s) to be displayed by typing them or selecting from the list.
Display Columns
The following column headings are displayed:
- Reservation order ID: Azure reservation order identifier.
- Reservation ID: The identifier of the reserved instance.
- Used hours: Number of reserved hours used for the specific reserved instance.
- Reserved hours: Number of total hours the reserved instance has for the dates selected.
- Utilization: Utilization percentage of the reserved instance for the dates selected.
Export Data
To export the Reservation Details report to a CSV file, click Export above the table.
Commitment Usage Distribution Over Time
A filterable table and corresponding chart which displays your commitments in a variety of ways. By placing your cursor in the filter field, you will see which parameters can be selected.

- Subscription ID: Subscription number identifier.
- Commitment ID: Identifier of the Reservation or Savings Plan. The row and ID appear when it fits within the relevant filters.
- Commitment Type: Reservation, Savings Plan
- Source: Eco or Non-Eco
- Equivalent OD Price: What the on-demand price would have been during that time period.
- Generated Savings: How much you saved due to using commitments' discounted rates instead of the full on-demand rates. Calculation: On-demand equivalent minus commitments minus uncovered spend. Not necessarily the same as net savings.
- $ Used: The total equivalent cost within the time range multiplied by the utilization.
- Example 1: If the time range covered the entire term of the reservation, it was 100% utilized, and the total equivalent cost was $1000, the result would be $1000.
- Example 2: If the time range was half the history of the same reservation, it would be $500.
- Example 3: If it was only 50% utilized during that period, it would be $250.
- Example 4: If the term of the RI is three years and only one year of the period has passed since it was purchased, it would be possible to show only 33.3% of the total equivalent cost in this field, at maximum.
- % Used: Utilization within that time period.
Export Data
To export the Commitment Usage Distribution Over Time Details table to a CSV file, click Export above the table.