Analyze Your Costs
The Cost Analysis page provides insights on past, current, and future cloud costs.
View per Subset
If you have Subsets enabled, the top of the Cost Analysis page will appear as shown below.
- To see analysis information for all accounts in your organization, leave the default setting as No Subsets. This view will not contain any billing workflows you may have associated with subsets.
- To see the analysis for a specific subset of accounts, click the Subsets box and choose a subset from the list. All the information in the page will apply specifically to the subset you chose. If a billing workflow has been associated with the subset, the data shown will contain the relevant adjustments.
If you do not have Subsets enabled and would like to use this feature, please contact the Support team and make a request.
Parts of the Cost Analysis
The Cost Analysis includes the following areas:
- Summary Line
- Account Efficiency Indicators
- Top Accounts
- Spend Analysis
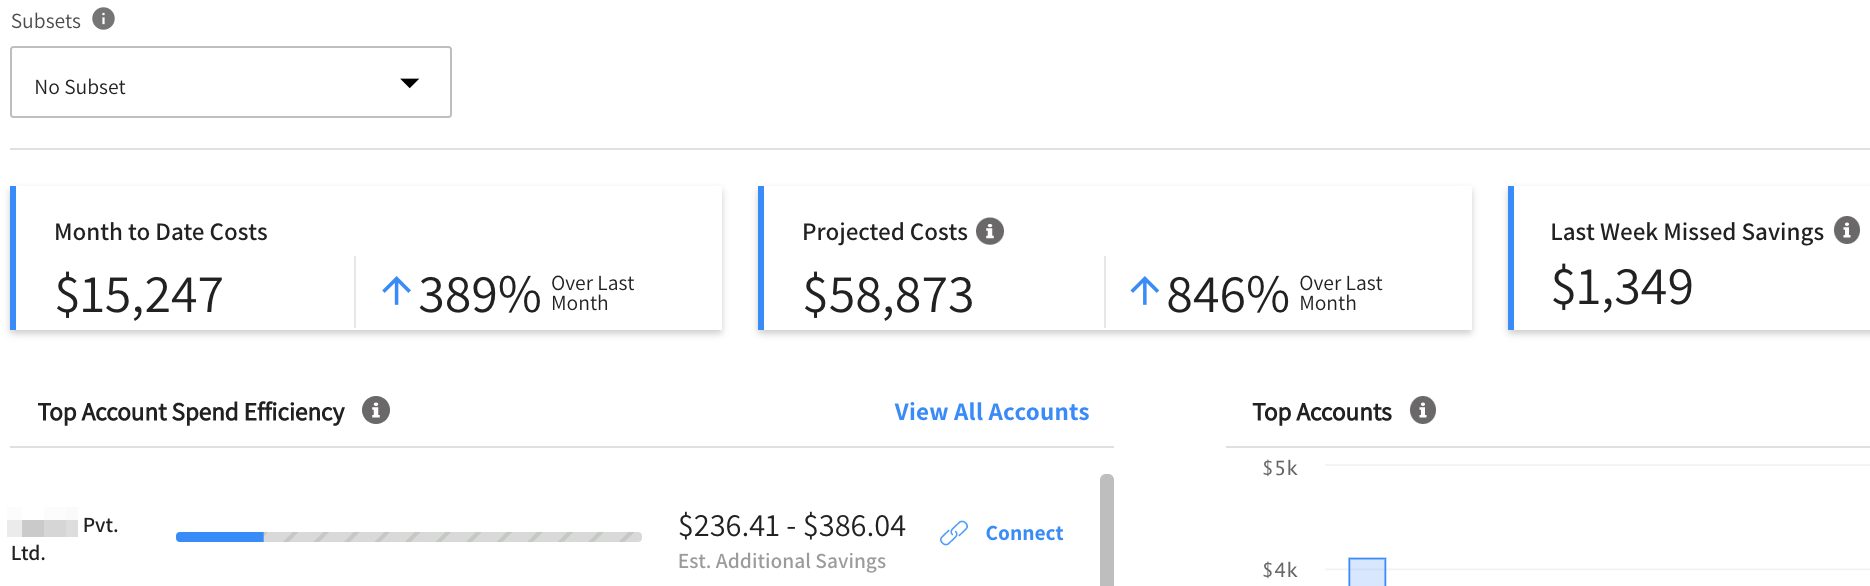
Summary Line
The Summary Line is at the top of the page and includes:
- Month to Date Costs: The total cost of your workloads from the beginning of the current month to present.
- Projected Costs: The forecasted cost at the end of the month based on analysis of your usage pattern.
- Last Week Missed Savings: Savings that could have been achieved in the previous seven days using optimization of spot instances and reservations.

Top Account Spend Efficiency
The top 10 accounts in your organization are listed according to the greatest amount of Estimated Additional Savings (shown in US dollars).
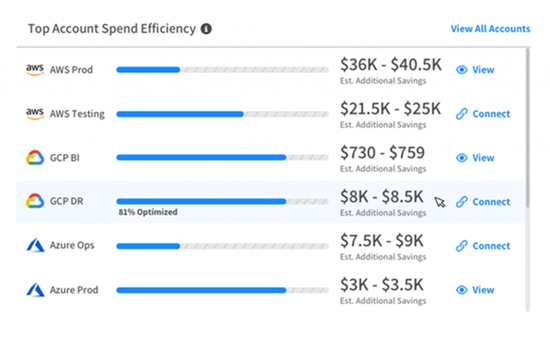
Each cloud account is assigned an efficiency score based on current and additional potential savings. The bars displayed indicate the efficiency score per account. The Estimated Additional Savings indicates how much can be further saved by leveraging the use of spot and reserved instances.
Efficiency is calculated: Efficiency % = (Current Savings/Potential savings)\*100
You can take these actions to further optimize your accounts:
- View: To view a detailed breakdown of a specific account, click View. The Optimization page will appear showing detailed information to help you optimize the account.
- Connect: To connect an account that is not yet managed by Spot, click Connect. You will be directed to the wizard that connects the account.
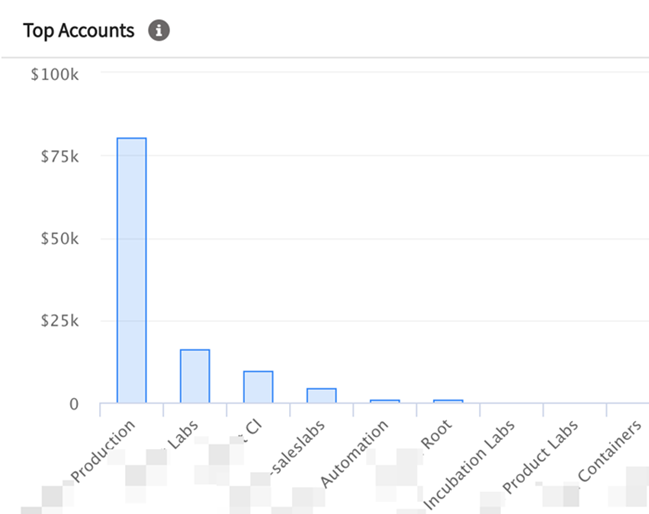
Top Accounts
This is a bar graph showing your top ten accounts by cost. The graph is based on the last 30 days of spend activity.
Spend Analysis
The Spend Analysis chart and table provide a breakdown of your organization's costs. These tools help you govern your organizational, account, departmental or project costs by providing a detailed view of the historical and current costs.
Data will only be shown from the start date of the billing file. In most cases that means the first day the CUR is generated, but for Eco Reports it may mean first day the modified CUR is generated. If you need more, retroactive data, please submit a support ticket.
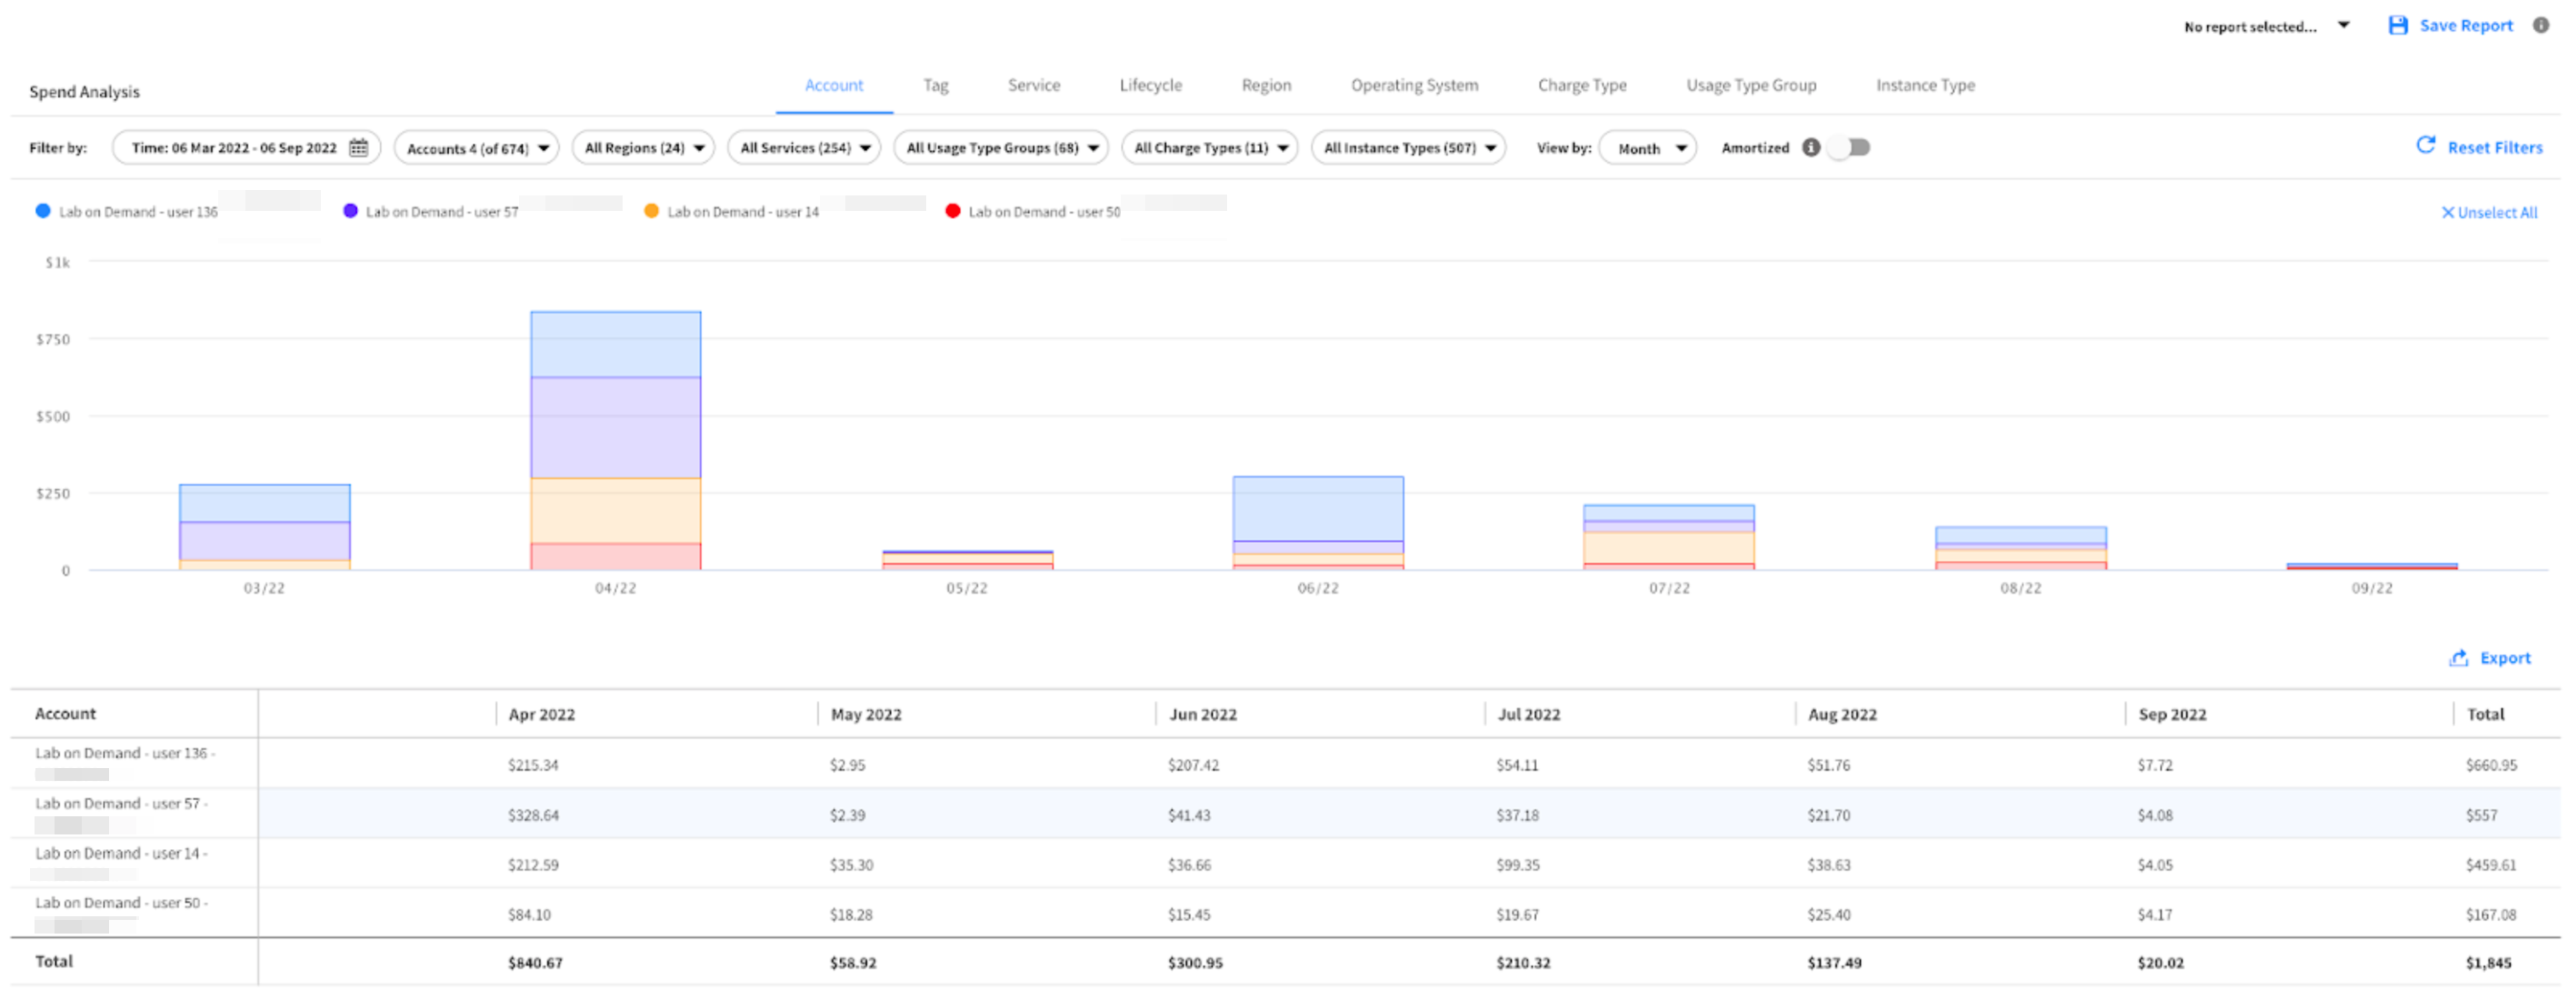
The chart and table show the cost breakdown for each of the following:
- Account
- Tag
- Service
- Lifecycle
- Region
- Operating system
- Charge Type
- Usage Type Group
- Instance Type
For example, if you click the Tag tab, the bars in the bar chart are broken down according to your tags, and the rows in the table display information per tag.
Static Filters
In addition, every tab can be further filtered by static filters, i.e., filters that appear regardless of the breakdown option selected. The following static filters are available:
- Accounts: Accounts in your organization, includes account identifier.
- Services: AWS services used, for example, EC2, ECS and RDS.
- Time: A range of dates.
- Region: Includes data for all regions available in AWS. Global means that the resource does not relate to any region.
- Charge Type: For example, reserved instance, on demand, and spot.
- Instance Type: Instance types used, for example, A1 and T2. Other resources present the data of all resources not managed by an instance.
- User Type Group (UTG): AWS filters that collect a specific category of usage type filters into one filter.
Amortized View
The Spend Analysis table has an Amortized view switch, which is on by default. In this view, upfront RI payments are spread across the RI commitment length. This enables you to see costs in accrual-based accounting as opposed to cash-based accounting.
Spend Analysis Table
Below the chart, you can find the spend analysis breakdown in table format which can be exported to CSV.