Dashboard
The Security Dashboard gives you a high-level summary of your cloud security posture. It also provides quick access to more detailed information and remediation actions.
The dashboard includes:
- Prioritized risk analysis
- Prioritized vulnerabilities
- Most common alerts
- Risks over time
You can get to the dashboard by clicking Spot Security > Dashboard.
Security Summary
You can see your main security statistics:
-
Identified Risks: The total number of misconfigurations currently in your environment based on the filters you’ve selected. Click View All Risks to see a detailed list of all the misconfigurations.
-
Security Rules Passed: The total number of security rules passed for all your assets.
-
Resources Scanned: Under Identified Risks, Spot displays the date and time of the last scan.
-
Risk Across Regions: The map shows the number of misconfigurations in each region where you have resources. Hover over the circle charts to see the number of low, medium, and high risks.
-
Breakdown by Severity: A color key shows the total number of risks per severity level including high, medium, and low.
View image
Filters and Asset Groups
You can use asset groups to filter findings for specific crown jewels, teams, or production accounts.
To edit an asset group, hover over a group in the list and click Edit .
To delete an asset group, hover over a group in the list and click Edit > Delete Asset Group.
View image
Create an Asset Group
- Go to Spot Security > Dashboard.
- Filter on the cloud provider, account, service, and region, then click Create Asset Group.
- Give the asset group a name (and mark as default asset group if needed).
- You can edit the filters and then click Save.
Prioritized Risk Analysis
Spot Security helps you prioritize risks by providing the prioritized actionable insights. The risks are sorted according to priorities, starting from 1 to 100 by default. Spot Security considers the asset status (internet facing), asset type, severity of the security rule, blast radius and access type (external access, public access) to calculate the priority. You can accept the risks using the Suppress action, and you will be presented with the next set of priorities. You can also filter the table, customize its columns, and export the table to a CSV file.
View image
Prioritized Vulnerability
The Prioritized Vulnerabilities table shows the vulnerability findings based on their priorities, ranging from 1 to 100 by default. Spot Security considers multiple criteria to provide you with a contextual ranking for the common vulnerabilities and exposures (CVE) and the asset. This lets you identify and address the most critical vulnerabilities first.
View image
Click the number of the Total Findings column of a vulnerability to view additional information, such as the OS, packages.
View image
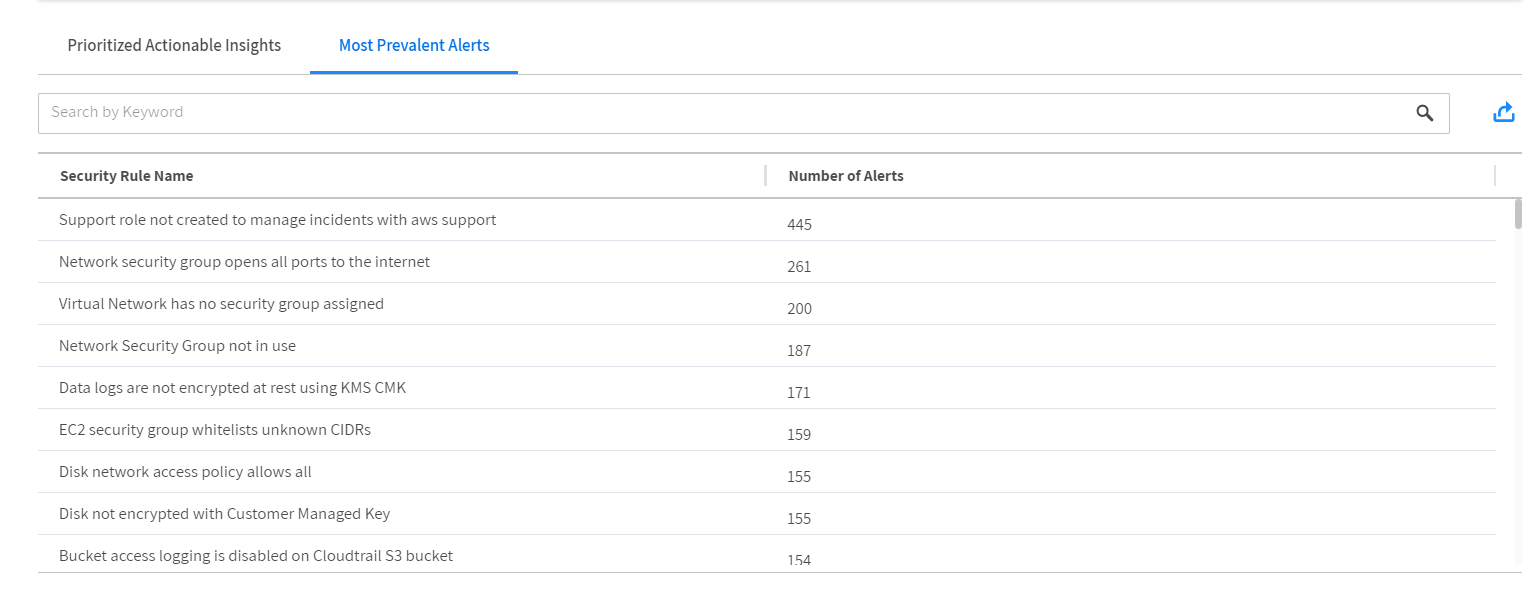
Most Prevalent Alerts
The shows the most common alerts detected in your environment. You can export the complete list of alerts.
View image
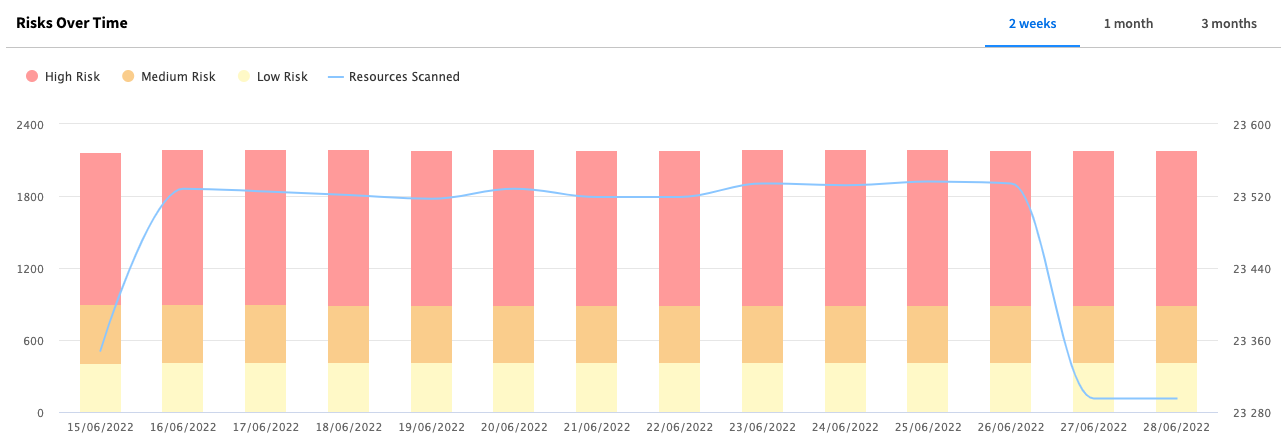
View Trends
You can see the risk trends over time. The line represents the number of resources scanned. The bars show the number of risks per time block and are broken down in colors by severity.
View image