Analyze Costs
Ocean for Apache Spark (Ocean Spark) provides full visibility into the cost of your Ocean Spark cluster, including a view of your total cloud compute costs over time. In addition, detailed information about your cloud consumption is provided in cost breakdown views showing core and application hours used.
Get Started
To get to the Cluster Cost Analysis tab, do the following:
- In the Spot console, go to Ocean for Spark in the menu tree and click Clusters.
- In the list of Clusters, click on a Cluster Name and click the Cost Analysis tab.
The Cost Analysis tab opens and shows the cluster name at the top. A graph of Spark App Cost over Time appears with Cloud Compute Cost as the default view.
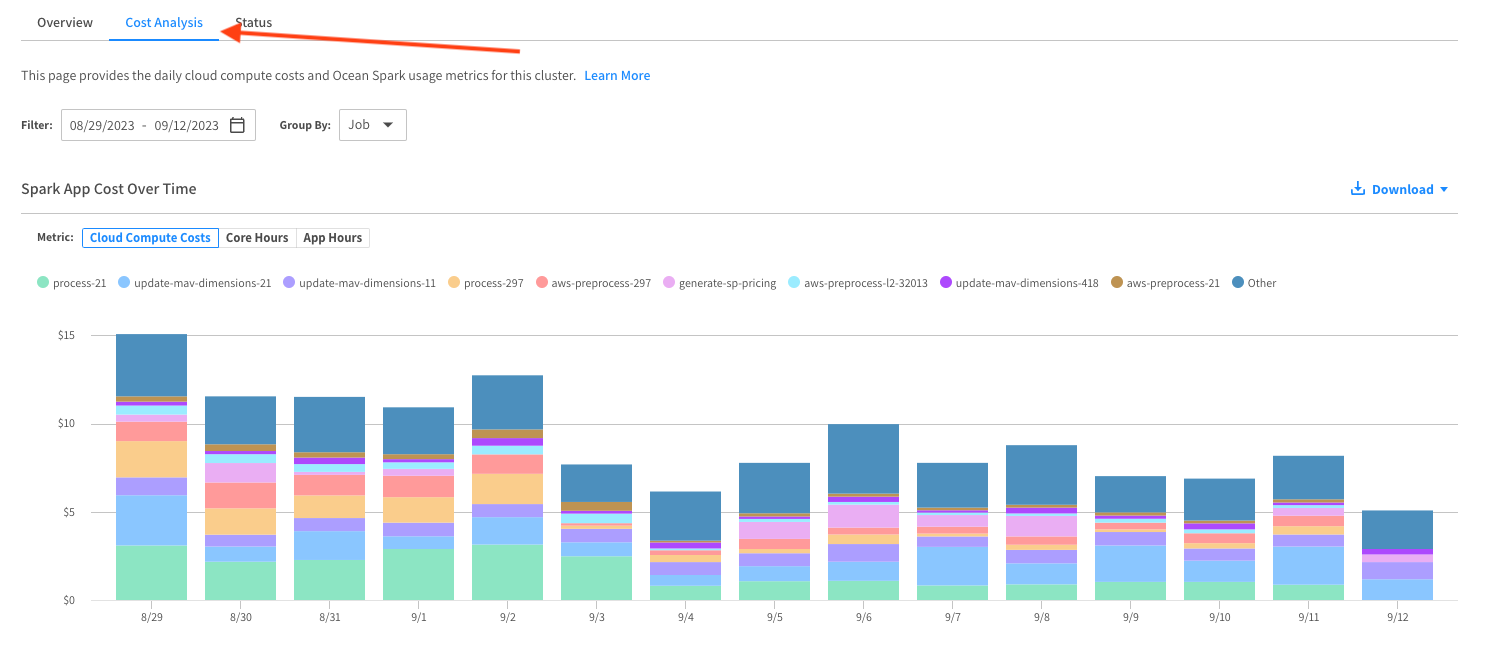
Spark App Cost over Time
The top part of the cost analysis page is a bar chart showing your Spark application usage metrics on the cluster over time.
Cloud compute costs, Core Hours, and App Hours are the usage metrics presented. The metrics are calculated for each Spark application that runs on the cluster. Cloud compute costs correspond to your cloud provider bill, while the Core Hours and App Hours metrics can influence your Ocean Spark service fee. These metrics are then aggregated per day, based on the timestamp (in UTC time zone) at which the application finished running in your cloud account.

Filtering and Grouping
You can adjust your view of the data by setting the following parameters:
- Filter by: Set the time range for displaying data in the chart.

- Group by: Group the data according to job or user.

Narrow down Information in the Chart
Each bar shows the total cost of the cluster for that time increment and is broken down to show the cost of each job or user in the cluster.
- You can include or exclude jobs or users from the display by clicking on the names in the key above the bars.
- To see a subtotal for a particular job or user, click on its color in a bar.
Cloud Cost View
Cloud cost is defined as the sum of compute (instances) and storage (volumes) costs incurred by running your Spark application in your cloud account. This information is estimated by Spot based on the cloud provider billing data, and based on your application resource requirements. You can also find similar information in the Ocean console.
Cloud Cost is the default view (as shown in the example above). Each bar in this chart shows the cost broken down into jobs. Each color in the bar represents a job. You can hover your mouse over the different colors in a bar to see information about each job.
It can take up to two days after an application's completion for the cost data to be accurate.

Core Hours View
Your Spark applications define the number of cores allocated to the driver pod and the number of cores allocated to each executor pod. The core hours used by an application correspond to the sum over each of these pods of the uptime duration of the pod multiplied by the number of cores allocated to it.
Sample calculation:
- A driver pod with one core runs for 30 minutes
- An executor pod with four cores runs for 30 minutes
- A second executor pod with four cores runs for 10 minutes and 15 seconds
This application used 1 * 30/60 + 4 * 30/60 + 4 * 615 / 3600 = 3.18 core hours.
In the Core Hours view, each bar shows the total number of core hours, and the different colors show the breakdown of core hours used by each job.

App Hours View
The App Hours metric is defined as the sum of the runtime durations of your application, where the runtime duration corresponds to the difference between the application's completion time, and the time when the application entered the Running state (meaning the Spark driver has started running).
In the App Hours view, each bar shows the total number of application hours, and the different colors show the breakdown of core hours used by each application.

Download
Click Download to download the data that forms any of the above cost analysis bar charts to a CSV file.

Top Spend Summary
Below the bar chart, a table summarizes your top spend jobs or users in the cluster. The jobs or users appear in order from highest to lowest cost proportion in your cluster.

The table includes the following information for each application:
- Job or User
- Core Hours
- App Hours
- Cloud Compute Costs
- % of Total Costs
The total cost for all the jobs or users in the cluster appears at the bottom of the table.
Drill Down
In the Top Spend Summary, you can see a breakdown of costs per application for each job or user. Just click on the job or user name.

Allocate Cloud Costs Using Custom Labels
You can define custom cost labels for each application you run on Ocean Spark.
Here is an example configuration which you can insert in your configuration templates, in your job configuration, or directly in your API calls as configOverrides.
{
  "labels": {
    "team": "data-engineering",
    "project": "etl",
    "environment": "production",
  }
}
You will then be able to view your cloud costs, grouped by these custom cost labels, using the Cost Analysis page of Ocean (and not Ocean Spark). To find this page:
- From your Ocean Spark cluster page, click "View cluster in Ocean".
- Then click "Cost Analysis".
- In the "Group By" dropdown, select "Label (Resource)", and then pick your label key ("team", "project", or "environment").
Visit the Ocean documentation to learn more about how Ocean estimates your cloud costs.
Related Topics
Learn more about monitoring your applications.